

NATO and various columnists employed by major U.S. newspapers and “think” tanks believe that military spending levels should be measured in comparison to nations’ financial economies. If you have more money, you should spend more money on wars and war preparations. I’m not sure if this is based on opinion polls in Afghanistan and Libya expressing gratitude for war as a public service or some other source of data less imaginary.
The view that gets less promotion from institutions funded by weapons companies is that military spending levels should be compared in terms of overall size. I agree with this one for a lot of purposes. It’s worth knowing which nations spend the most and least overall. It matters how far the U.S. is out in the lead, and is probably more important that NATO collectively dominates the rest of the globe than that some NATO members fail to spend 2% of their GDP.
But a very common way to compare countless other measurements is per capita, and this seems valuable to me too, when it comes to military spending.
First, the usual caveats. The total of U.S. government spending on militarism each year is, according to numerous independent calculations, about $1.25 trillion, but the number provided by SIPRI which provides numbers for most other countries (thereby allowing comparisons) is about a half a trillion less than that. Nobody has any data on North Korea. SIPRI data used here, as on this map, is for 2019 in 2018 U.S. dollars (because used to compare year to year), and population sizes are taken from here.
Now, what do per capita comparisons tell us? They tell us which country cares about which other country’s spending. India and Pakistan spend the exact same amount per capita. The Czech Republic and Slovakia spend the exact same amount per capita. They also tell us that the nations most heavily investing in war in comparison to the number of people they have are very different from the list of leading war spenders overall — with the exception that the United States is in first place on both lists (but its lead is radically smaller in the per capita rankings). Here’s a list of spending on militarism per person by a sample of governments:
United States $2170
Israel $2158
Saudi Arabia $1827
Oman $1493
Norway $1372
Australia $1064
Denmark $814
France $775
Finland $751
UK $747
Germany $615
Sweden $609
Switzerland $605
Canada $595
New Zealand $589
Greece $535
Italy $473
Portugal $458
Russia $439
Belgium $433
Spain $380
Japan $370
Poland $323
Bulgaria $315
Chile $283
Czech Republic $280
Slovenia $280
Romania $264
Croatia $260
Turkey $249
Algeria $231
Colombia $212
Hungary $204
China $189
Iraq $186
Brazil $132
Iran $114
Ukraine $110
Thailand $105
Morocco $104
Peru $82
North Macedonia $75
South Africa $61
Bosnia-Herzegovina $57
India $52
Pakistan $52
Mexico $50
Bolivia $50
Indonesia $27
Moldova $17
Nepal $14
DRCongo $3
Iceland $0
Costa Rica $0
As with a comparison of absolute spending, one has to travel far down the list to find any of the designated enemies of the U.S. government. But here Russia jumps to the top of that list, spending a full 20% of what the U.S. does per person, while only spending less than 9% in total dollars. In contrast, China slides down the list, spending less than 9% per person what the United States does, while spending 37% in absolute dollars. Iran, meanwhile, spends 5% per capita what the U.S. does, compared to just over 1% in total spending.
Meanwhile, the list of U.S. allies and weapons customers that lead the rankings (among those nations trailing behind the United States itself) shifts. In more familiar overall terms, we’d be looking at India, Saudi Arabia, France, Germany, UK, Italy, Brazil, Australia, and Canada as the top spenders. In per capita terms, we’re looking at Israel, Saudi Arabia, Oman, Norway, Australia, Denmark, France, Finland, and UK as the most militarized countries. The top militarists in absolute terms overlap more heavily with the top weapons dealers (the United States, trailed by France, Russia, UK, Germany, China, Italy) and with the permanent members of that organization created to end war, the UN Security Council (U.S., UK, France, China, Russia).
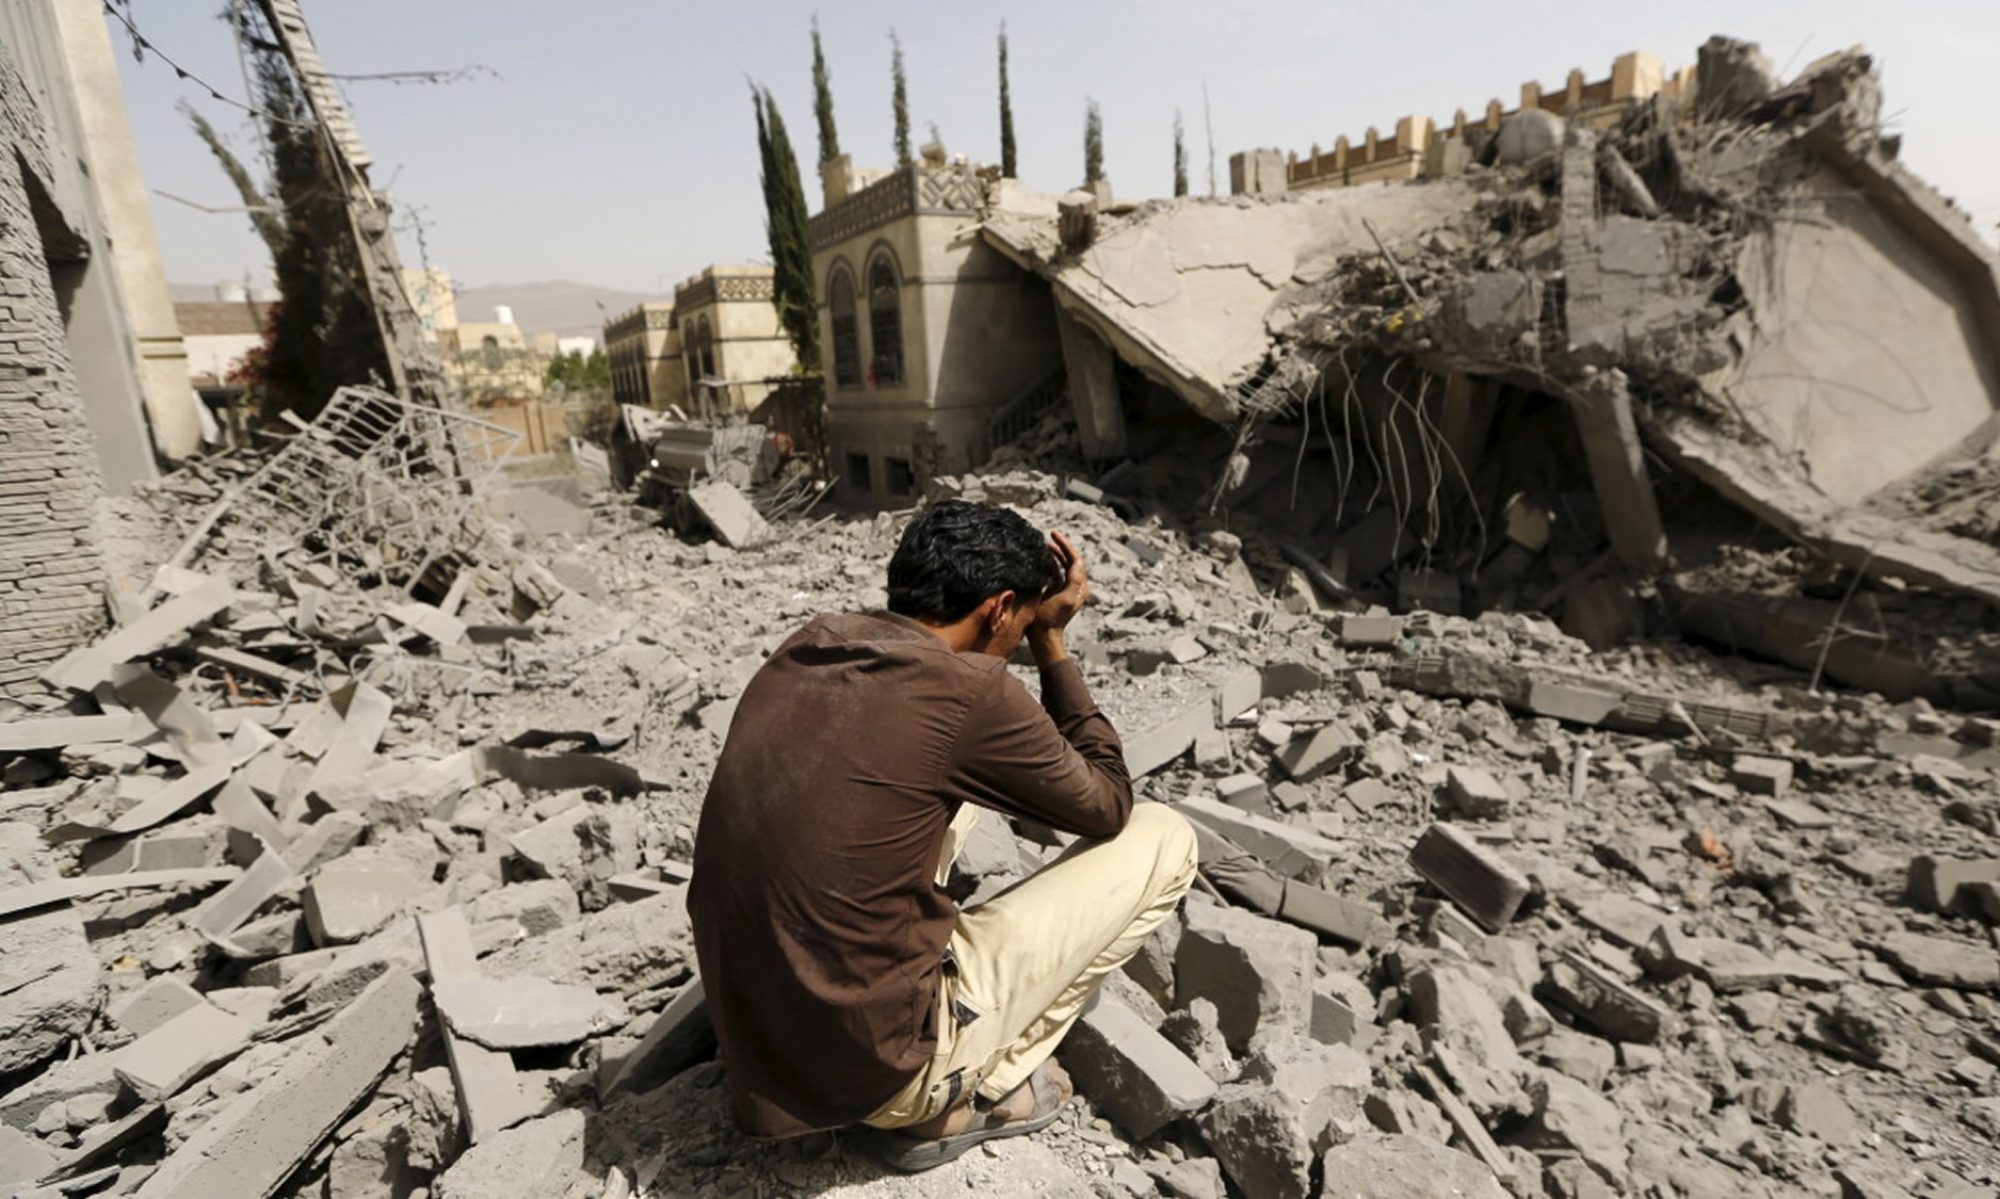
The leaders in military spending per capita are all among the closest U.S. allies and weapons customers. They include an Apartheid state in Palestine, brutal royal dictatorships in the Middle East (partnered with the United States in destroying Yemen), and Scandinavian social democracies that some of us in the United States often see as better directing resources to human and environmental needs (not just better than the United States at this, but better than most other countries as well).
There are some correlations between military spending per capita and lack of human well-being, but numerous other factors are clearly relevant, Only two of the leading 10 war spenders per capita (U.S. and UK) are also among the top 10 sites of COVID deaths per capita. Resources for human and environmental needs can be found by reducing inequality and oligarchy, but can also easily be found by defunding militarism. What people in the United States may want to ask themselves is whether they each — every man, woman, child, and infant — benefit from spending over $2,000 every year for the wars of a government that can’t give even specially selected people $2,000 to survive a pandemic and economic crisis. And is that supposed benefit of military spending many times whatever it is that most other countries get out of their military spending?
Remember, contrary to popular mythology, the United States ranks very poorly in comparison with other wealthy countries in every measure of freedom, health, education, prevention of poverty, environmental sustainability, prosperity, economic mobility, and democracy. That the United States is at the top in only two major things, prisons and wars, should give us pause.